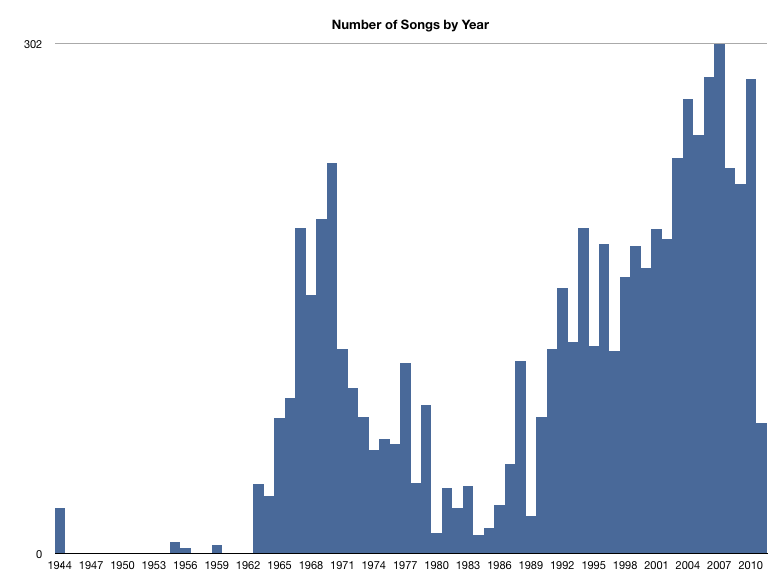
This graph shows the count of songs in my music library by year. The graph was produced from a CSV generated by a Python script that pulls data from iTunes using Apple’s Scripting Bridge technology. Eventually I want to go back and redo the script so that it draws the graph itself (matplotlib would work well).
Notes:
- The graph was generated in June 2011 so the song count for 2011 doesn’t include music acquired after that date.
- The graph starts at 1944 because everything in my library older than that is classical. There isn’t a consistent method for splitting classical music into tracks; one record might be divided into 20 tracks while another of the same length might be one continuous track. Track count just isn’t a useful metric.
- Songs with an empty year tag aren’t counted.
- The 1980s were a musical dark age.
This is the script to generate the csv. Note that it iterates over “iTunes.currentPlaylist().tracks()” meaning that it will collect data from whichever playlist is highlighted in iTunes’ Library pane.
from Foundation import *
from ScriptingBridge import *

iTunes = SBApplication.applicationWithBundleIdentifier_(
            "com.apple.iTunes")

years = {}

for track in iTunes.currentPlaylist().tracks():
    if not track.year() in years:
        years[track.year()] = 1
    else:
        years[track.year()] += 1

f = open('./out.csv', 'w')

for key in sorted(years.keys()):
    f.write(str(key)+', '+str(years[key]) +'\n')

f.close()